Introduction
Planning graphics and presentation techniques are essential components in the field of urban and regional planning, architecture, landscape design, and related disciplines. They serve as the visual language through which complex data, designs, and concepts are communicated effectively to stakeholders, including clients, public officials, and the general public. Mastery of these techniques ensures that planners can convey their ideas clearly and persuasively, facilitating informed decision-making and community engagement.
The Importance of Planning Graphics
- Visualization of Ideas: Planning graphics enable the visualization of abstract concepts and ideas. Through diagrams, maps, and illustrations, planners can depict the spatial relationships, design intentions, and functional aspects of their proposals.
- Communication Tool: Effective graphics serve as a universal language that transcends cultural and linguistic barriers. They help in conveying complex information in a simplified manner, making it accessible to a diverse audience.
- Decision-Making Support: Clear and concise visual representations aid decision-makers in understanding the implications of various planning options. This support is crucial for obtaining approvals and funding for projects.
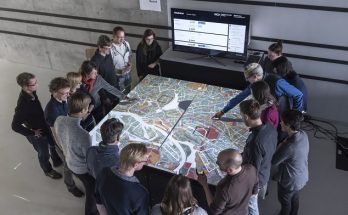
- Public Engagement: Graphics play a pivotal role in engaging the public. They make planning processes more transparent and participatory, allowing community members to visualize potential changes and provide meaningful feedback.
Types of Planning Graphics
- Maps: Maps are fundamental in planning. They range from simple location maps to complex thematic maps that show zoning, land use, transportation networks, and environmental constraints.
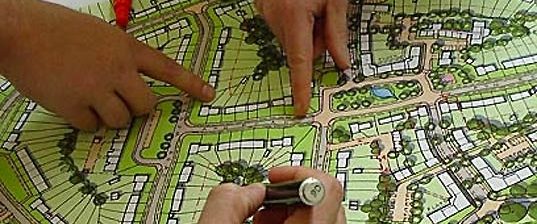
- Site Plans: These are detailed representations of proposed developments, showing building footprints, landscaping, parking areas, and access points. They are essential for obtaining planning permissions.
- Diagrams: Diagrams are used to illustrate concepts, processes, and relationships. Flowcharts, bubble diagrams, and network diagrams are common types.
- Sections and Elevations: These drawings show vertical cuts through buildings or landscapes, revealing interior layouts, structural elements, and façade treatments.
- 3D Models: With advancements in technology, 3D modeling has become a powerful tool in planning. It allows for realistic representations of proposed developments, providing a comprehensive view from various angles.
- Renderings and Visualizations: These are artistic representations that depict the proposed development in its final form. They are used to convey aesthetic qualities and the overall feel of the project.
Presentation Techniques
- Clarity and Simplicity: The primary goal of any presentation is to communicate information clearly and effectively. Graphics should be simple, avoiding unnecessary complexity that can confuse the audience.
- Consistency: Consistency in color schemes, fonts, and styles across all graphics ensures a cohesive presentation. It helps in maintaining a professional appearance and reinforces the planner’s brand identity.
- Use of Color: Color can enhance the readability and appeal of graphics. However, it should be used judiciously to highlight key elements and convey specific information, such as land use categories or transportation routes.
- Labeling and Annotation: Labels and annotations provide essential context to the graphics. All elements should be clearly labeled, and explanatory notes should be added where necessary to aid understanding.
- Hierarchy of Information: Establishing a hierarchy of information helps in guiding the audience through the graphic. Important elements should be more prominent, while less critical details can be subdued.
- Interactive Elements: In digital presentations, interactive elements such as clickable maps, zoomable diagrams, and animated sequences can enhance engagement and provide a more immersive experience.
- Narrative Structure: A well-structured narrative should accompany the graphics. It provides a logical flow, linking the visual elements to the overarching story or argument being presented.
- Use of Technology: Software tools like AutoCAD, Adobe Illustrator, SketchUp, and GIS platforms are invaluable in creating high-quality graphics. Familiarity with these tools is essential for modern planners.
Best Practices in Planning Graphics and Presentation
- Know Your Audience: Tailor the presentation to the knowledge level and interests of the audience. Technical details may be appropriate for experts, while simplified visuals are better for the general public.
- Iteration and Feedback: Develop graphics iteratively, seeking feedback from colleagues and stakeholders. This process helps in refining the visuals and ensuring they effectively communicate the intended message.
- Case Studies and Examples: Use case studies and real-world examples to illustrate points. This approach makes the presentation more relatable and demonstrates the practical application of planning concepts.
- Integration of Data: Integrate relevant data into the graphics to support the arguments being made. Data-driven visuals, such as charts and infographics, can enhance credibility and persuasiveness.
- Accessibility: Ensure that the graphics are accessible to all audience members, including those with visual impairments. Use high-contrast colors, large fonts, and alternative text descriptions for digital content.
Conclusion
Planning graphics and presentation techniques are vital tools in the planner’s toolkit. They facilitate the effective communication of ideas, support decision-making, and engage the public in the planning process. By mastering these techniques and adhering to best practices, planners can ensure that their proposals are understood, appreciated, and implemented, ultimately contributing to the creation of better communities and environments.